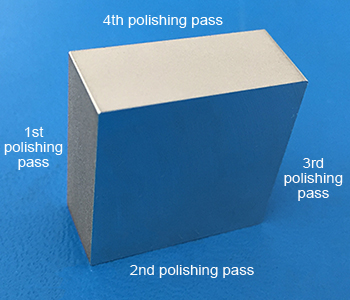
Fig. 1. Metal part that has a different surface finish on each of the four sides, the 1st pass being the roughest and the 4th pass the smoothest.
Surface Roughness Measurements & Surface Finish Measurements
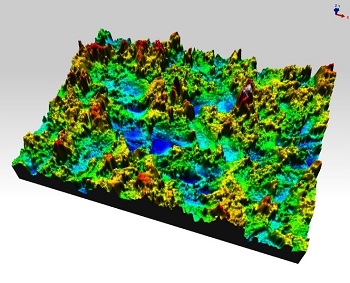
One of the most common applications for profilometers of any type is the characterization and analysis of surface roughness and surface finish. An optical profilometer is an excellent choice for surface roughness measurement and analysis. With one scan, a 3-dimensional surface profile is obtained that provides a wealth of parameters to specify the surface characteristics. Common places to find optical profilometers are machining and tooling industries, but also in lapping, polishing, and optical businesses that need to measure surface finish.
For surface roughness and surface finish measurements, contact our surface profile experts.
Filmetrics® offers free trial measurements - results are typically available in 1-2 days.
Search Applications
Surface Roughness Measurement Example
In the figures below, we are measuring the surface profile of a metal part as it is polished through 4 passes. Fig. 1 indicates the number of polishing passes that have been applied to each corresponding side, with the roughest surface finish having only 1 pass and the smoothest having 4 passes.
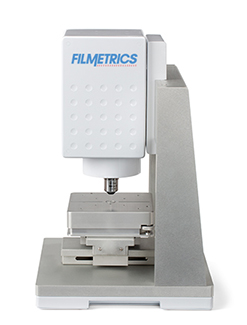
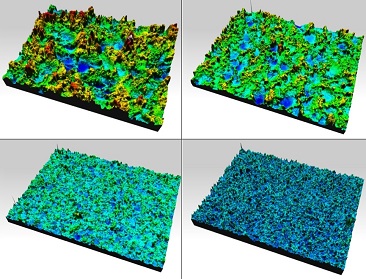
Each side was measured on the Profilm3D® profilometer with a 10x objective at the 4x zoom setting to assess the surface roughness. Fig. 2 shows the four scans from each side; it is clear to see that the surface is getting smoother with each polishing pass.
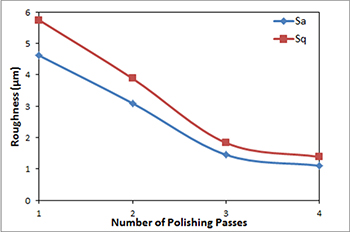
To put the changes in surface roughness in numbers we can measure, we can use comprehensive roughness parameters such as Sa and Sq. Plotting the surface roughness versus the number of polishing passes (fig. 3) shows how the surface roughness decreases with increased polishing. The surface roughness decrease slows down with the number of finishes. It is also clear from these data that the fourth polishing pass added only a marginal improvement.
Measurement Set Up
Recipe Used
Click for expanded view
Fig. 2. Scans of each polishing pass, top left: pass 1, top right: pass 2, bottom left: pass 3, bottom right: pass 4.
Measurement Result
Click for expanded view
Fig. 3. Roughness parameters Sa and Sq as functions of each polishing pass.